Project Factory Dashboard
Introduction
Goal
The goal of this project is to showcase the development of an IT system.
In the virtual scenario of this project, an imaginary factory manager wants a dashboard on his mobile phone to monitor the performance of the factory.
Dashboard
The dashboard can be accessed using this link:
System Specification
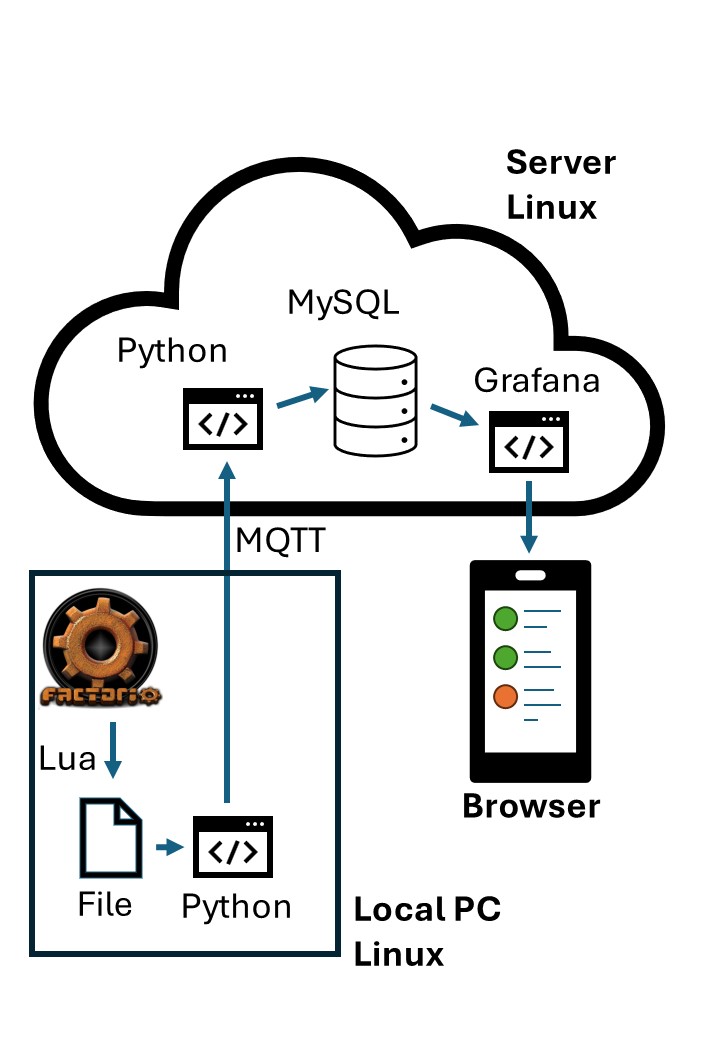
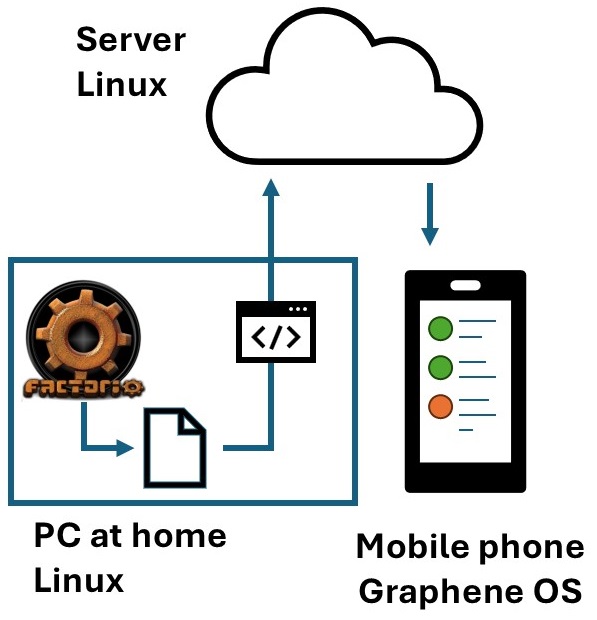
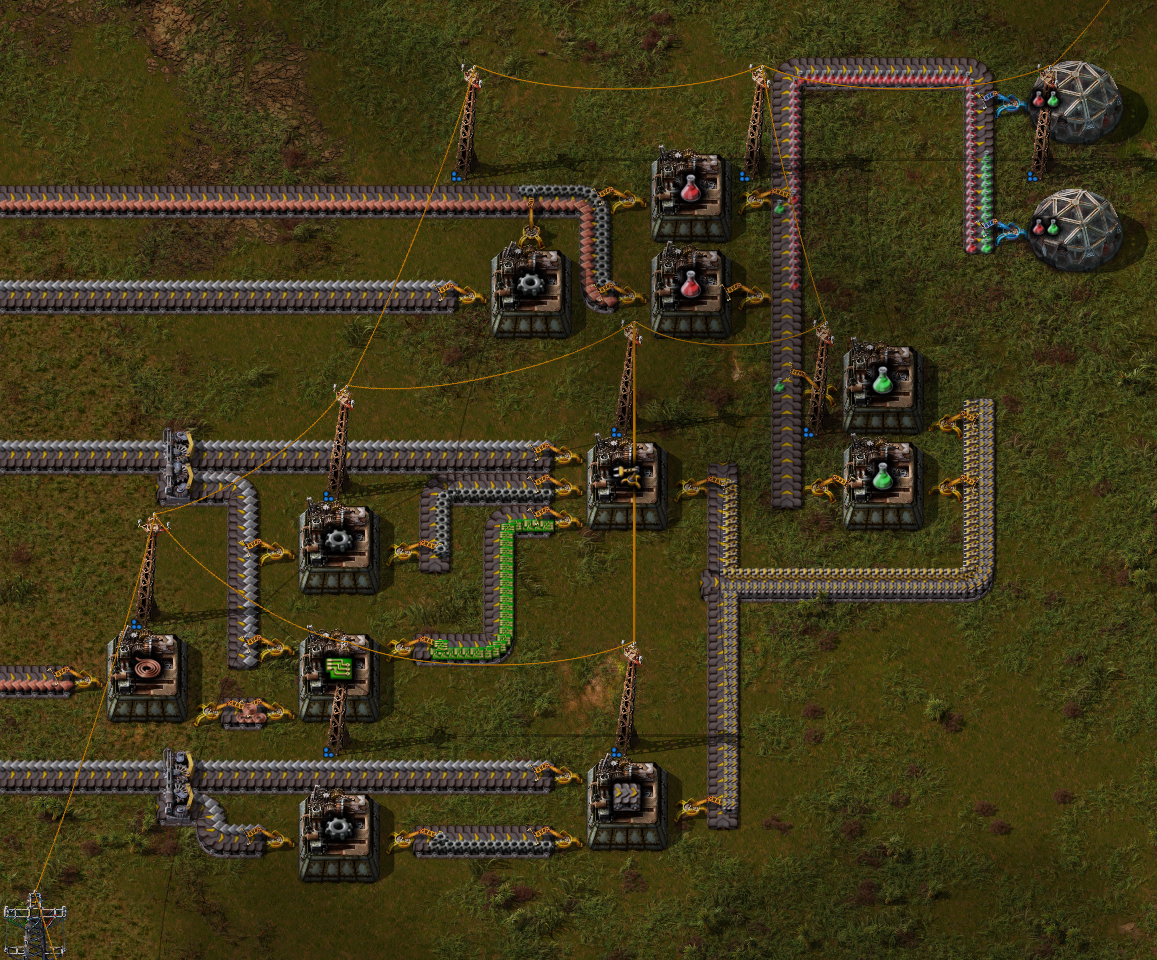
The idea for the system is displayed in figure 1. The game Factorio serves as a virtual factory.
The game will be modified using its built-in modding system to write performance data to a file. This data will be uploaded to a server and most likely stored in a SQL database. Based on the content of the SQL database, a HTML page will be updated periodically, which can be accessed by any browser.
Project Focus
The priority was put on creating a minimum viable product (MVP) as fast as possible. Reasons being
- the unknown complexity and
- the unknown deadline,
- and the wish to demonstrate a fully functional system.
This decision is reflected in the choice of the tools, focusing when possible on lightweight and beginner-friendly open-source products.
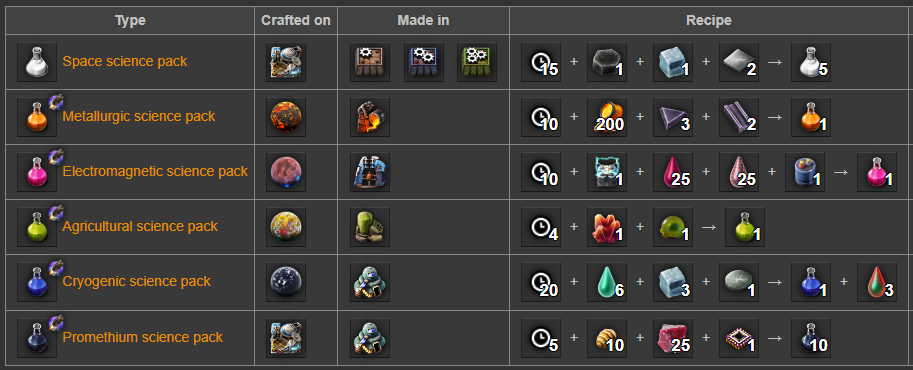
Science Production As Factory Metric
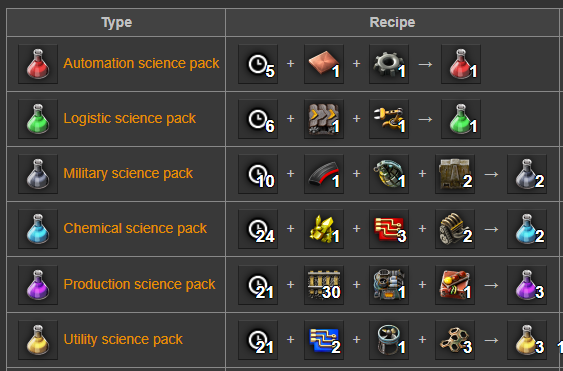
One of Factorios most central mechanics is the production of science packs, which are consumed in laboratories to research new technologies or obtain other benefits. The player starts with primitive methods, only capable of building the first type of science packs (the red ones). After researching enough technologies, it is possible to build the next type of science packs - logistic science packs, the green ones - and research more advanced technologies. Through increasing complexity, they are meant to guide the player through the game.
In total there are 12 types of science packs, see list below. The goal of the example factory shall be to produce 30 science packs of each type per second.
Implementation
Setting Up The Server
Choice Of VPS Provider
Virtural Private Servers (VPS) are a popular choice when it comes to fast, flexible and cheap server solutions for both private individuals and small companies. Popular, beginner friendly prividers are for example GoDaddy or Vultr. Hetzner was chosen as it has a reputation of a reliable and high quality service.
Security Setup
In this project, the VPS-setup guide by Bluehost was followed.
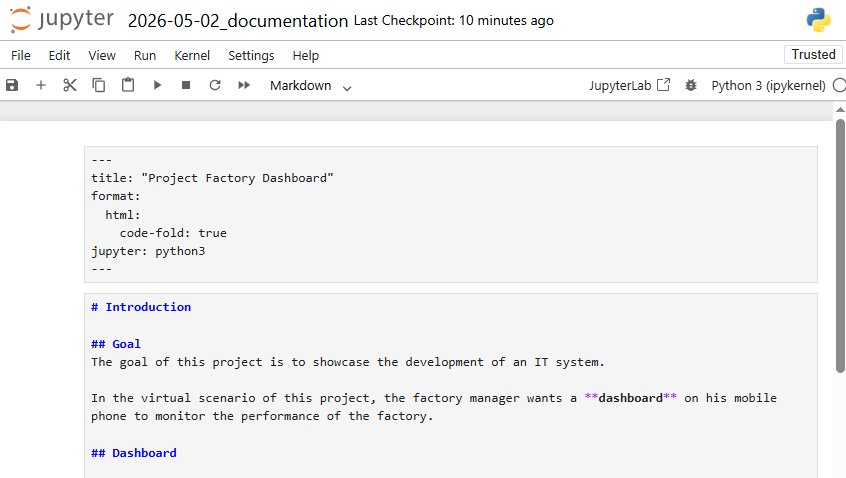
Jupytier Notebook + Quarto + Apache
In order to create documentation which is located on the server and easily accessible for everyone, the following pipeline was implemented.
- Jupyter Notebook is used as an advanced markdown software
- Quarto is used to render the notebook content into a HTML document
- This document is copied into the directory of an Apache HTTP Server
- You are reading this document right now.
Choice Of Database
MySQL was chosen as it is an easy-to-use and widespread database software.
SQL Table
The in-game production rates are stored in a table, together with a time stamp. The SQL Table was created using the statement
CREATE TABLE science_production(
id INT AUTO_INCREMENT PRIMARY KEY,
time_stamp DATETIME,
s01 INT, -- Automation science packs per second
s02 INT, -- Logistic science packs per second
s03 INT, -- Military science packs per second
s04 INT, -- Chemical science packs per second
s05 INT, -- Production science packs per second
s06 INT, -- Utility science packs per second
s07 INT, -- Space science packs per second
s08 INT, -- Metallurgic science packs per second
s09 INT, -- Electromagnetic science packs per second
s10 INT, -- Agricultural science packs per second
s11 INT, -- Cryogenic science packs per second
s12 INT -- Promethium science packs per second
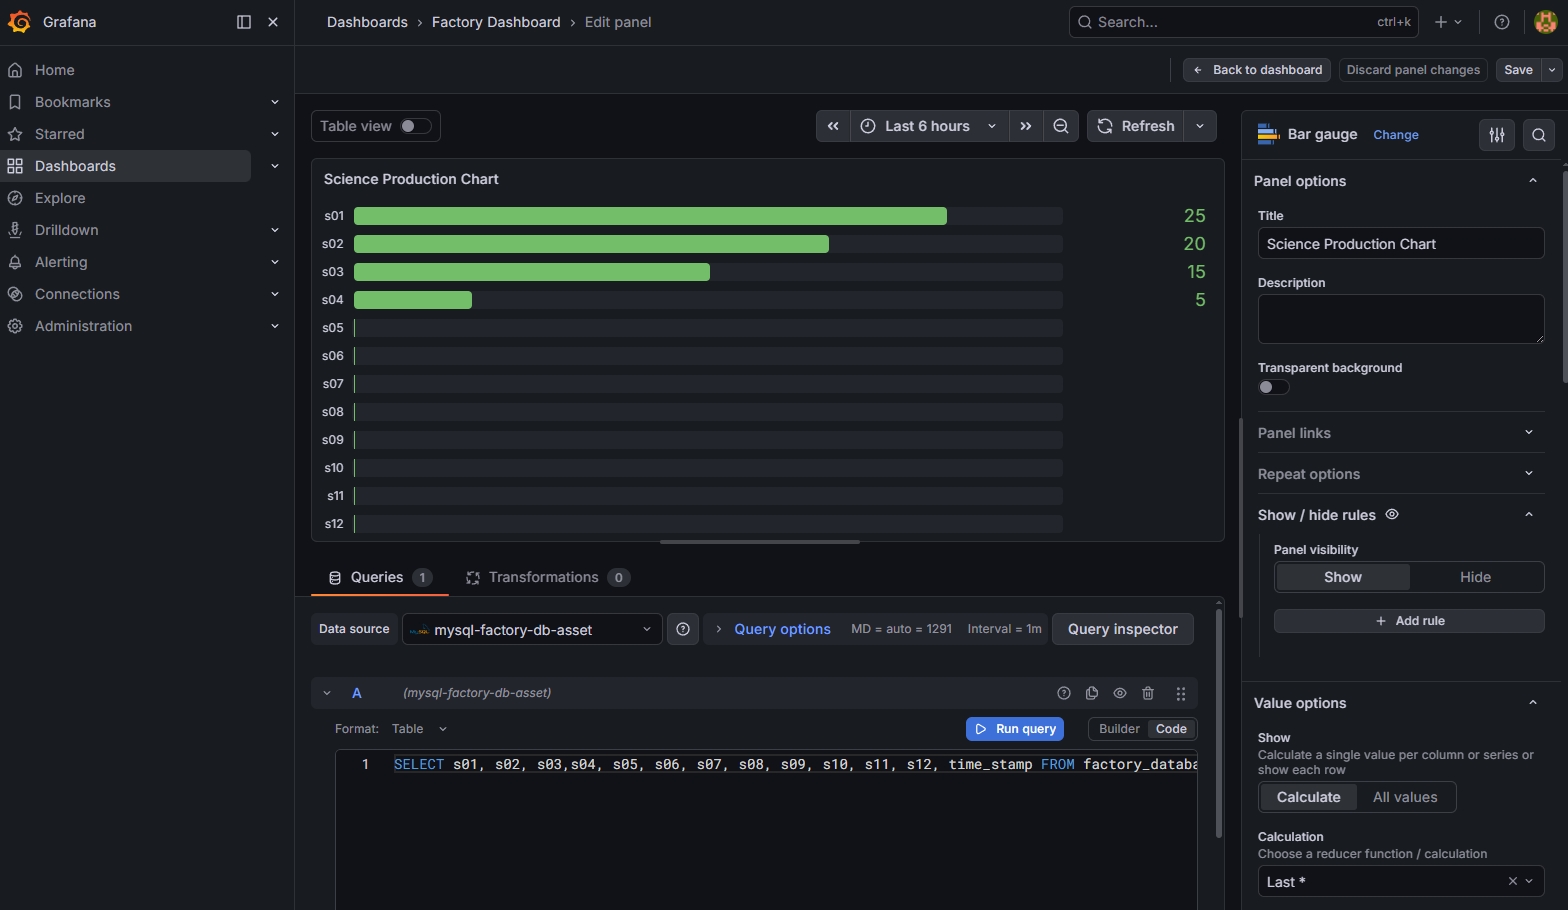
);Choice Of Data Visualization Tool
Some data visualization tools are marketed as BI and dashboard platforms. They provide the full traditional analytics stack (data access, visualization and sharing) and are easy-to-use. Other tools are developer-first and visualization libraries, that provide great customization and low-level building blocks.
Grafana was not only chosen, because it belongs to the first category, it was also originally built for time-series data and monitoring - which might be interesting in a hypothetical second stage of the project (displaying a production-over-time graph).
Choice Of Message Broker
First, an attempt was made to use RabbitMQ in Java, but the complex overhead was a disadvantage.
Instead, Paho MQTT in Python was used. The MQTT-standard, as realized in Mosquitto, is an easy-to-use, lightweight message broker. The connection was established using Transport Layer Security (TLS), which means that the authentication is done via certification files. Through this project, I learned the importance of careful handling of file permissions, and the value of log-files in troubleshooting processes.
The Server- and Client-Side Python Scripts
The client-side python script reads the CSV-file periodically every 4 seconds and sends its content in a message to the server. The python script on the server side receives this information and hands it over to the MySQL database. Both scripts emphasize error handling (to make the system robust) and logging (for debugging purposes). Git was used in the development of these scripts. A basic understanding of Mosquitto was developed through a tutorial, but the final code is largely provided by AI.
Modification Of Factorio
Although the developers of Factorio, Team Wube, made it possible to modify the game in various ways, there is little documentation on the specific task that was demanded for this project, which also leads to AI being of poor help. With little debugging possibilities on top, the extraction of these twelve integer values - science packs produced per minute - took longer than expected, but was successful in the end.
Appendix
Original System Draft